SAM-TB
Home
My data
My analysis
My samples
Help
FAQ
中文
Sign in
##Pairwise SNP distance ###Operating instructions (1) Create analysis: ① Click “+ New analysis” and select “Pairwise SNP distance”. The page will jump to the “Home” page of SNP distance analysis. ② Click “+Add samples” to select samples, or click “+Batch add” and enter the ID in the floating window to add the samples (≥2 samples) for pairwise SNP distance analysis. Note:only samples whose “single sample variants analysis” has been completed normally can be selected or added for the pairwise SNP distance analysis. If a sample has been analyzed multiple times, only the most recent variants analysis result will be used. ③ Click “Modifiable Parameters” at the bottom right of the page to view or modify parameters, then click “Start” to start the analysis. 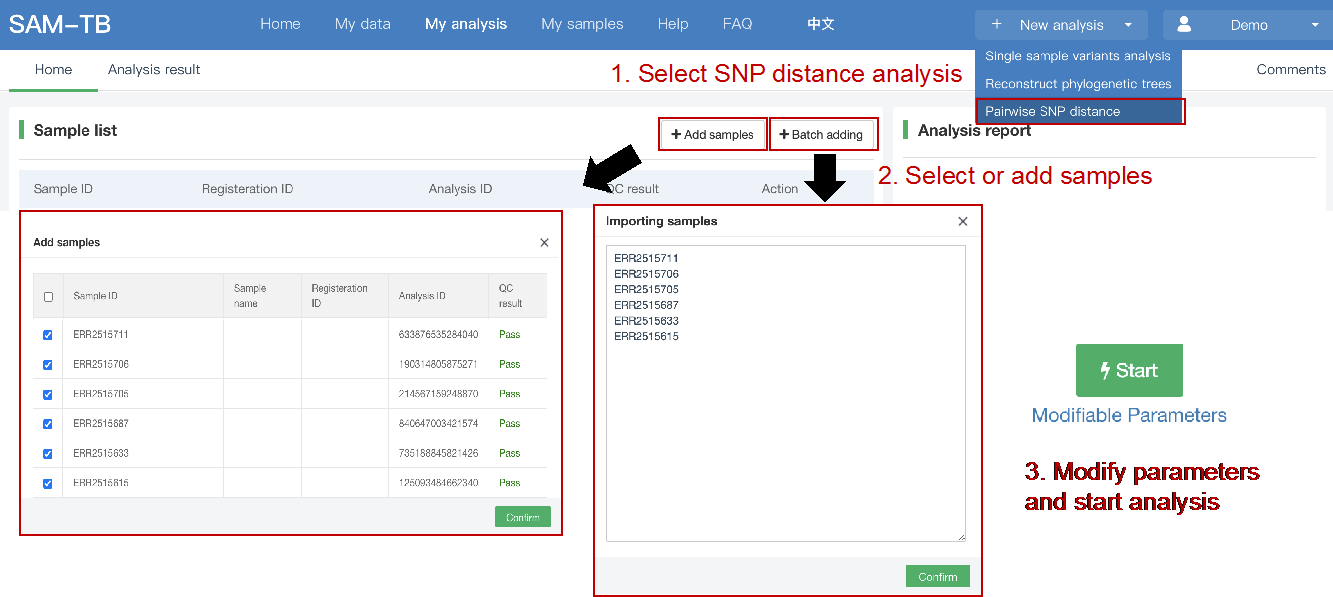 Note: the "QC" column provides the results of whether the quality of the sample sequence is adequate for pairwise SNP distance analysis. The QC "failed" sample may affect the results, and is best not used. 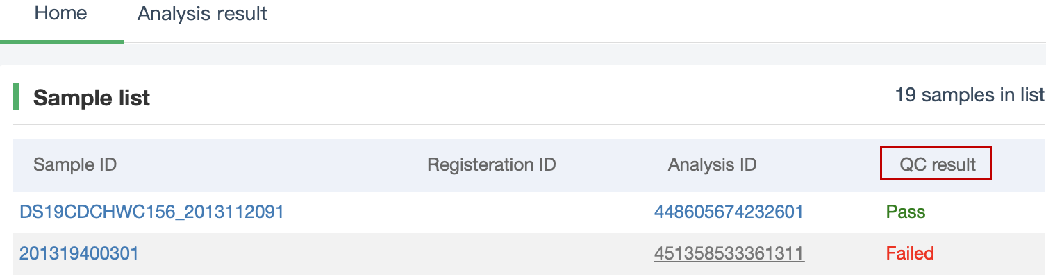 (2) Stop analysis: the analyses with “Running” status can be stopped by clicking “Stop” at the bottom of the page. (3) Reanalyze: click “Modifiable Parameters” in the page to modify the parameters, then the analysis with “Completed” status can be redone by clicking “Restart”. Note: when reanalyze is used, the old results will be overwritten. ###Explanation of results After the analysis is completed normally, you can switch to different result pages by clicking on “Home” and “Analysis result” in the secondary navigation bar. (1)The “Home” page shows the samples selected for pairwise SNP distance analysis on the left and the analysis logs on the right. 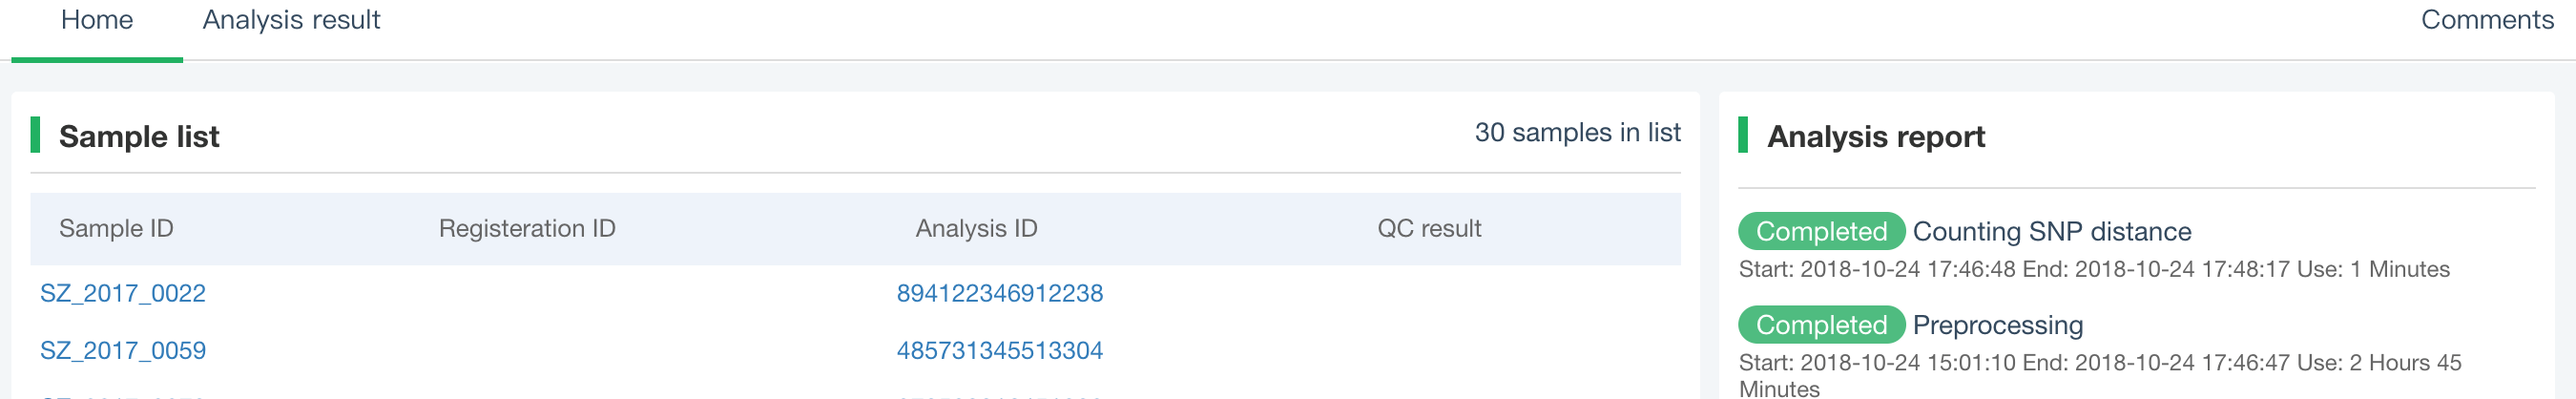 (2) The “Analysis result” page shows the results of pairwise SNP distance and the graphs drawn based on the results, including the heatmap of SNP distance between two strains, the histogram of distance distribution and minimum distance (the minimum SNP distance between one strain and all other strains) distribution. Click "Download" at the top right of the graph to download it. ① The list of pairwise SNP distance: displays the SNP distance (number of different SNPs) between two strains and the strains’ sublineage. “Location” is the “Hometown/Birthplace” of the patient which was imported when the user created the sample. Click “Export” and set the threshold to export pairs of strains whose SNP distance is less than the threshold (.csv format). 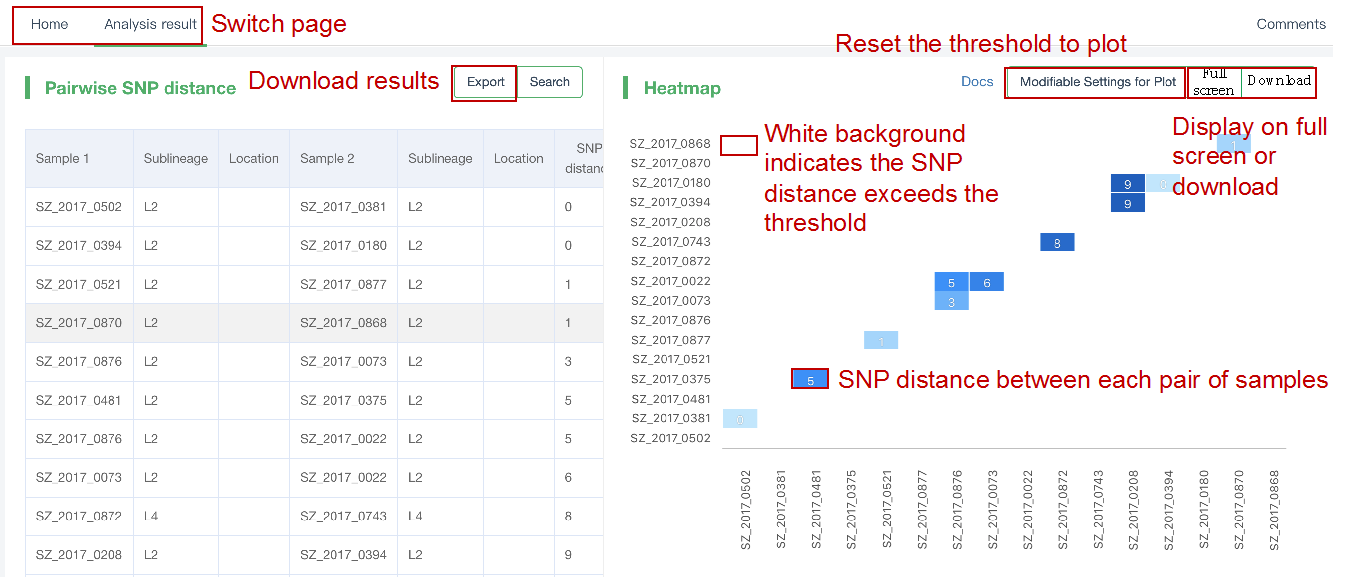 ② Heatmap: the heatmap is drawn by default using the strain pairs with a distance ≤ 100. Click “Modifiable Setting for Plot” to reset the distance threshold and draw the graph accordingly. Click “full screen” to show the picture in the full screen. Click “Download” to download it. ③ Distance distribution: the horizontal axis represents the range of genetic distance, and the vertical axis represents the number of strain pairs with this distance. Hover the mouse on the histogram to view the count of strain pairs whose distance is within the range indicated on the horizontal axis. For instance, the figure below shows that there are seven pairs of strains with SNP distance between 0 and 5. Click “download” to download the figure. The count of strain pairs within the distance range cannot be displayed in the download version. 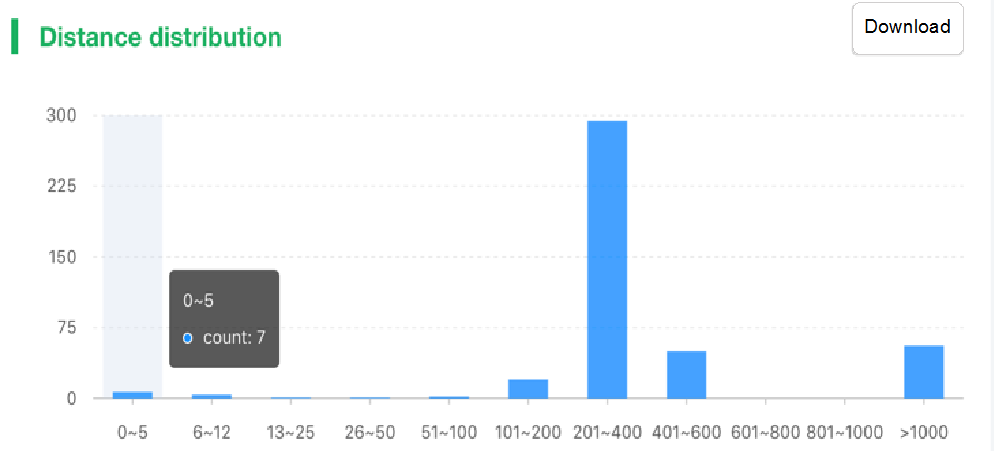 ④ Minimum distance distribution: the horizontal axis indicates the range of genetic distance, and the vertical axis indicates the number of strains. Hover the mouse on the histogram to view the count of strains with the indicated minimum distance. For instance, the figure below shows that there are three strains that differ by 5 SNPs from other strains. Click “download” to download the figure. The count of strains with each particular minimum distance cannot be displayed in the downloaded version. 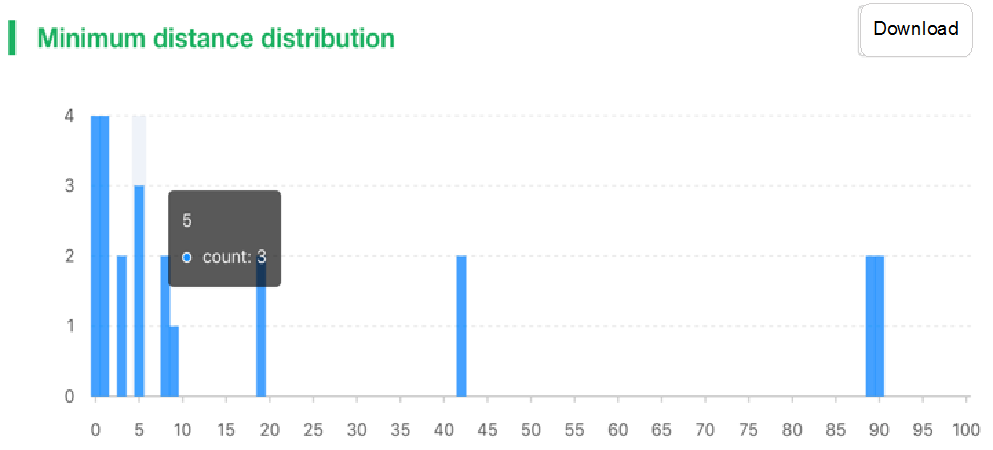
<< Return
Title:
Description:
Thank you for using our service, we will reply you by email as soon as possible.